
The latest data from Rystad Energy shows that Australia’s large-scale solar and wind assets generated a total of 5,420 GWh of clean energy in December 2025, up 19% from the 4,551 GWh generated in the same month a year earlier.
Rystad Senior Analyst David Dixon said New South Wales (NSW) clean energy assets led the pack, generating a total of 1,678 GWh of renewable electricity, with 1,052 GWh from utility PV and 626 GWh from wind.
Dixon said the NSW result marked a first for Australia’s energy market with December 2025 the first time any state has generated more than 1 TWh from utility solar on a monthly basis.
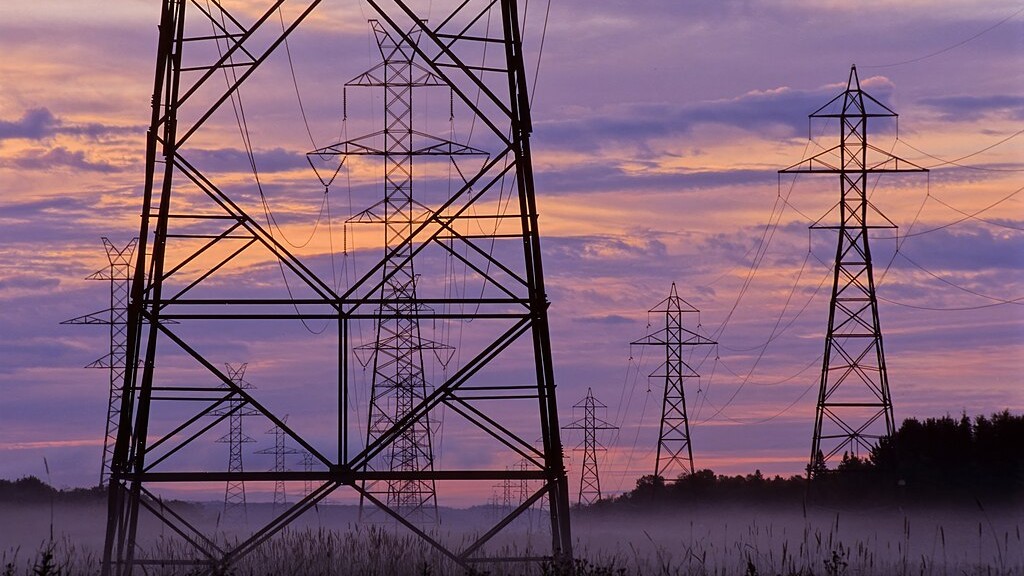
December 2025 was also the highest month of renewable generation in the National Electricity Market (NEM) with 9.5 TWh, or 50.4% of total generation. It was also the highest month of renewable generation in Western Australia’s Wholesale Energy Market (WEM) at 1.07 TWh, or 53.9% of total generation.
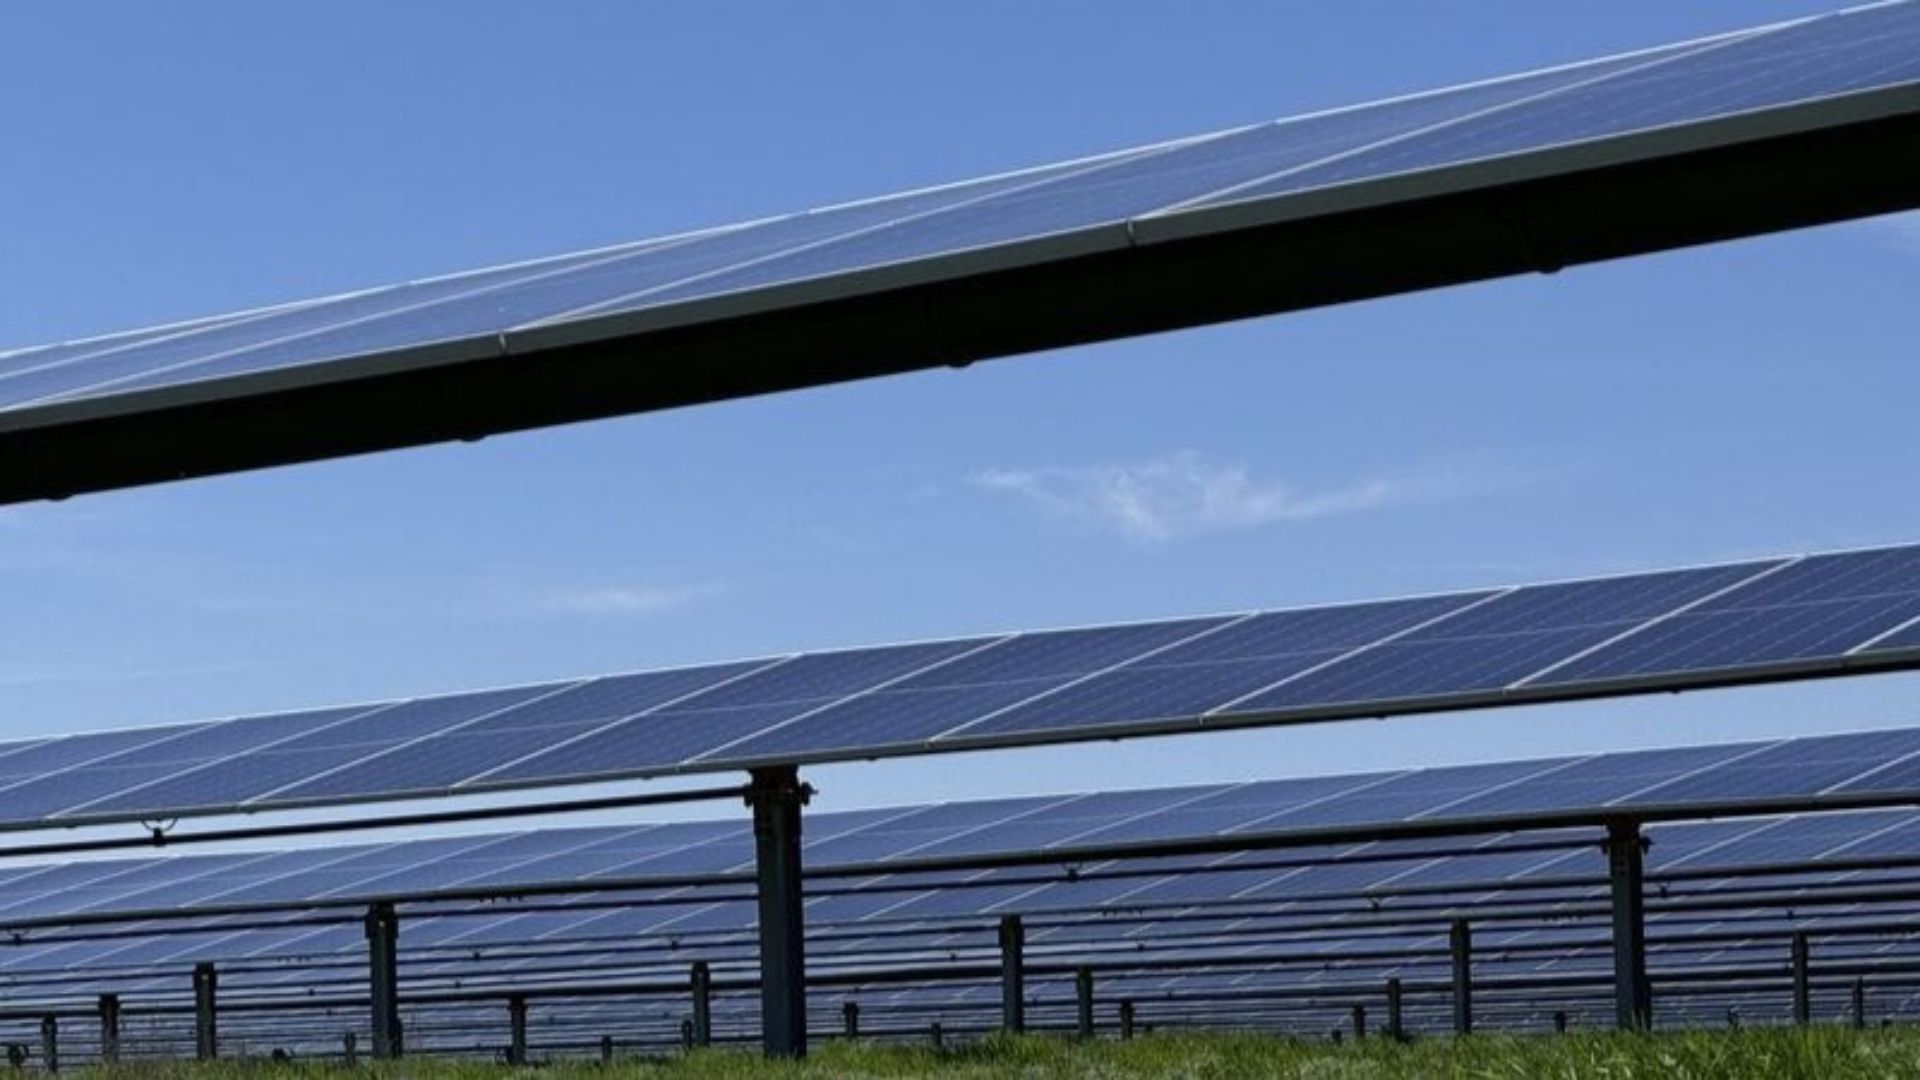
NSW was home to 11 of the top 20 performing solar farms in December but it was SUN Energy’s 100 MW Merredin Solar Farm in Western Australia’s central Wheatbelt region that topped the charts with an average capacity factor (CF) of 45.2% for the month.
French renewables developer Neoen’s 36 MW Griffith Solar Farm in southwest NSW was second with 40.1% CF while Fotowatio Renewable Ventures’ 56 MW Moree Solar Farm in the state’s central west was third with a CF of 39.7%.
South Korea-based investment manager Hana Financial Investment’s 162 MW Columboola PV plant in Queensland’s Western Downs region and Maoneng’s 200 MW Sunraysia Solar Farm in southwest NSW rounded out the top five.
The top-performing wind assets were mostly located in Western Australia with APA Group’s Badgingarra (60.0 % CF), Alinta Energy/RATCH-Australia’s Yandin Wind Farm (59.9% CF) and Potentia Energy/Synergy’s Warradarge (56.2 % CF) leading the way.
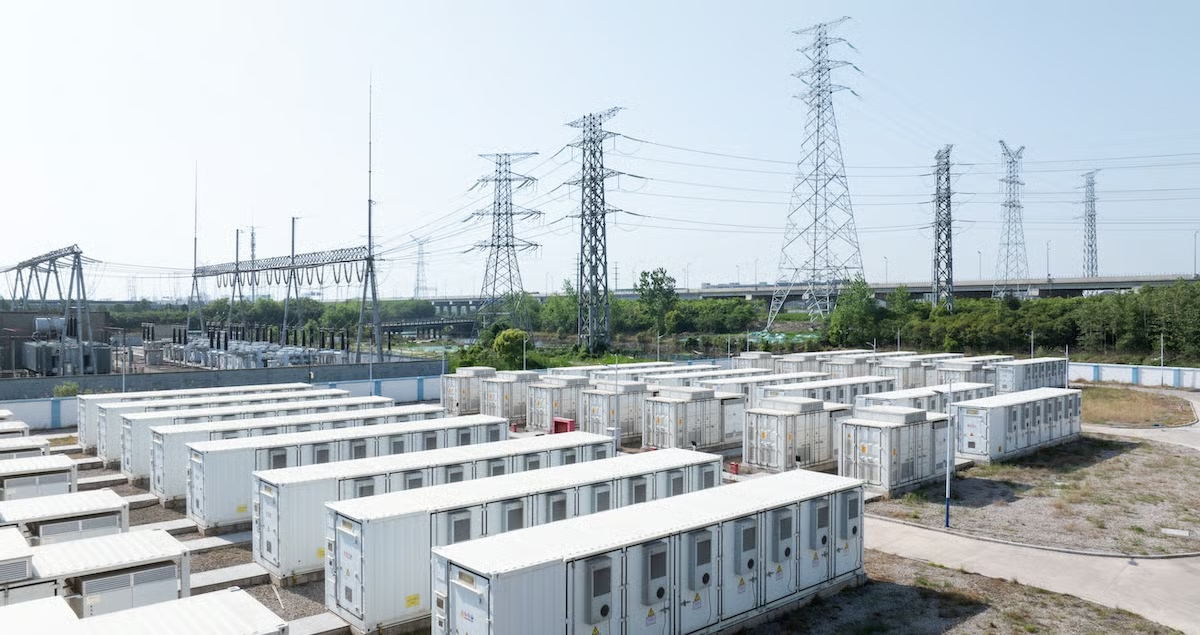
Dixon said utility battery energy storage systems continued to grow at a fast pace in December with discharging increasing more than three times year on year in both the NEM and WEM.
In the NEM, utility batteries discharged 248 GWh in December 2025, up from 68 GWh in the same months last year, while in the WEM utility batteries discharged 102 GWh, up from 32 GWh in December 2024.