
November 2025 marked the 27th consecutive month that solar was the number one source of new generating capacity in the United States. Since September 2023, solar has remained the top monthly contributor of new generating capacity in the country.
Of the 35,321 MW total added to the grid in the first 11 months of 2025, solar contributed 25,467 MW. For comparison, wind followed at 15.8% (5,563 MW), while new natural gas additions lagged behind at 11.8% (4,179 MW).
The November data confirmed a major shift in the US energy landscape: Utility-scale solar capacity has officially surpassed wind capacity.
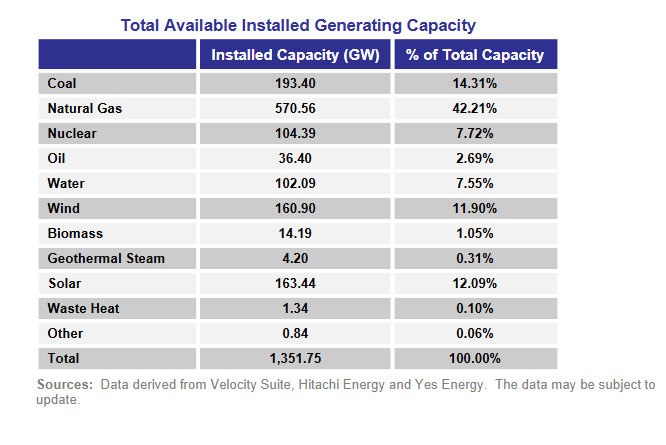
Total solar capacity now stands at 163.4 GW compared to 160.9 GW for wind. This transition is notable because, just a few years ago, wind’s installed base was significantly larger. The rapid expansion of solar, driven by falling costs, has allowed it to close the gap and take the lead.
While natural gas remains the largest single source of total US capacity at 43.1%, coal has dropped to 14.7%. Solar has climbed to 12.6% of the total mix, followed by wind at 12.4%, nuclear at 7.9%, and hydropower at 7.5%.
These figures only include utility-scale projects. When including small-scale rooftop solar, which adds significant volume to the nation’s power, renewables now comprise over one-third of total US capacity.
FERC’s high probability additions through November 2028 suggest that solar’s growth is only accelerating. Over the next three years, FERC expects 86,130 MW of solar and 19,821 MW of wind to be added.
During that same period, natural gas is expected to add only 8,983 MW while coal is projected to see 19,741 MW in retirements.
If these projections hold, solar is on track to become the second-largest source of installed capacity in the U.S. by 2028, trailing only natural gas.